
Japan’s Cosmetics Import Market - Korea Won the Skincare Battle.

A Deep-Dive Analysis Using Japan Customs Data at HS9 Level
Written by: Kim Pedersen, JapanTradeStatistics
2026/06/29

The headline is simple.
South Korea overtook France as Japan’s largest source of beauty and skincare imports in 2022.
It is also incomplete.
Zoom out to the full cosmetics landscape, fragrance, skincare, makeup, hair care, and toiletries combined, and a far more complex picture emerges. Korea has won a decisive battle. But France is winning a different one. And China has been quietly building a position that the industry has barely acknowledged.
SCOPE OF THIS REPORT
This report focuses on two HS4 codes within Chapter 33 of Japan’s customs tariff:
• HS3303, Perfumes and eau de cologne (fragrance)
• HS3304, Beauty and skincare preparations (makeup, skincare, lip, eye, nail, sunscreen)
Together these represent the core consumer-facing cosmetics import market in Japan. Other Chapter 33 codes, HS3301 (essential oils), HS3302 (odoriferous mixtures), HS3305 (hair care), HS3306 (oral care), and HS3307 (other toiletries), appear in the opening market overview but are not analyzed in detail.
Part One: The Market in Full
The right starting point is the broadest possible lens: all Chapter 33 imports combined, across major suppliers, from 2005 to today.
Chapter 33 covers the full cosmetics and toiletries market imported into Japan:
HS3301, Essential oils • HS3302, Odoriferous mixtures • HS3303, Fragrance • HS3304, Beauty & skincare • HS3305, Hair care • HS3306, Oral care • HS3307, Other toiletries
The combined annual chart for the six major supplier countries, France, Korea, China, USA, Ireland, and Italy, from 2005 to 2025 tells a story that no single-code analysis can show.

Chart 1:
HS3301–3307 combined, JPY value, France / Korea / China / USA / Ireland / Italy, annual 2005–2025
Source: Japan Ministry of Finance / JapanTradeStatistics
What the Data Shows
France (bright green, top line): From ~¥60 billion in 2005 to ~¥120 billion in 2025, despite a temporary dip around 2019–2020. Today, France is at an all-time high.
Korea (grey): From near zero to ~¥140 billion. Growth accelerates sharply post-2019 and overtakes France around 2022–2023. The trajectory is not linear, it is almost vertical.
China (dark blue): From ~¥25 billion to ~¥100 billion. Steady, consistent growth across two decades. Rarely discussed. Consistently significant.
USA (black): From ~¥55 billion to ~¥60 billion. Flat for twenty years. Once a top-tier supplier comparable to France, now overtaken by Korea and China, barely ahead of Ireland.
Ireland (purple): ~¥20–25 billion throughout, flat. Reflects its role as the European manufacturing and headquarters base for several multinational cosmetics groups. These are not Irish consumer brands, they are products manufactured in or transiting through Ireland, attributed to Irish origin by customs.
Italy (light green): From ~¥10 billion to ~¥20 billion. Slow, steady premium growth.

Three Critical Takeaways
First, France is not losing Japan’s cosmetics market. It is at an all-time high. The narrative that “France is losing to Korea” is true only within HS3304. Across all cosmetics categories combined, France’s exports to Japan have roughly doubled over twenty years.
Second, China is the hidden giant. At ~¥100 billion annually, China is one of Japan’s largest cosmetics suppliers. It is largely absent from industry narratives. This is not a minor oversight, it fundamentally distorts the competitive picture.
Third, The United States has been quietly declining for twenty years. In 2005, the US was a top-tier supplier, comparable to France. Today it has been overtaken by Korea and China, and sits barely ahead of Ireland. This is one of the most significant, and least reported, shifts in the market.
Part Two: Understanding the HS Code System
Reading trade statistics accurately requires understanding how the classification system works, because it changes, and those changes directly affect how data should be interpreted.
What the HS System Is
The Harmonized System (HS) is an international product classification framework maintained by the World Customs Organization (WCO), used by over 200 countries as the foundation of global trade data. Japan extends the internationally standardised six-digit HS codes into nine-digit HS9 codes for more granular national classification. These Japan-specific nine-digit codes are revised annually by the Ministry of Finance.
Cosmetics are classified primarily under Chapter 33. The most recent major WCO revision was HS2022, which came into effect on 1 January 2022.
Two Sources of Data Discontinuity
Confidentiality processing (秘匿化処理):
When publishing data for a specific HS9 code would reveal the trade secrets of an individual importer or exporter, Japan Customs suppresses that data on application. The affected figures are transferred into the “other” catch-all category within the same HS heading. Apparent drops in specific sub-codes may reflect this mechanism rather than actual changes in trade.
Periodic HS revision:
When Japan’s Ministry of Finance revises the nine-digit sub-code structure, products previously classified under one code may be reclassified into a new or different code. Historical data for the old code stops at the revision date; a new series begins. This creates apparent discontinuities that reflect administrative reclassification, not changes in real trade flows.
What This Means for This Report
Several HS9 codes within HS3304 show data only through 2022 or 2023: HS330491010, HS330491090, HS330499012, and HS330499019. The simultaneous appearance of significant values in HS330499010 from early 2023, for both France and Korea, is consistent with products from discontinued codes being reclassified here.
Where these discontinuities affect the analysis, they are explicitly flagged. For official code correspondence tables, see the Japan Tariff Association (日本関税協会) at kanzei.or.jp and Japan Customs at customs.go.jp.
Part Three: HS3303, France’s Unchallenged Fragrance Position
Before examining HS3304, HS3303 must be understood, because it fundamentally changes the interpretation of France’s overall position in Japan.
The JapanTradeStatistics.com chart for HS3303, perfumes and eau de cologne, JPY value, France, Korea, China, and USA, monthly 2015–2025, tells an unambiguous story.
France: Starts at ~¥1.2 billion per month in 2015. Drops sharply around 2019–2020. Then accelerates dramatically from 2021, reaching peaks of ~¥3.0–3.2 billion per month by 2023–2024. France’s fragrance exports to Japan are at their highest point in the dataset.
USA: Grows slowly to ~¥0.3–0.5 billion per month by 2025. A distant second.
Korea and China: Near zero throughout. Essentially absent from Japan’s fragrance market.

Chart 4:
HS3303 (fragrance), JPY value, France / Korea / China / USA, monthly 2015–2025
France dominant and accelerating;
Korea and China essentially absent
Source: Japan Ministry of Finance / JapanTradeStatistics
The gap between France and the nearest competitor in HS3303 is wider than the gap between Korea and France in HS3304. France did not simply retreat from skincare, it simultaneously built an unchallenged and growing fragrance position that more than offsets its HS3304 losses in total value terms.
This context is not optional for understanding Japan’s cosmetics market. It is essential.
Part Four: HS3304, Where Korea Won
HS3304, beauty preparations, skincare, makeup, lip, eye, nail, and sunscreen, is where the most dramatic competitive shift in Japan’s cosmetics import market has occurred. Within this code, the K-beauty narrative is correct.
The Old Order
For nearly thirty years, imported beauty preparations in Japan meant France.
Chanel. Lancôme. Dior. L’Oréal.
These brands defined the category. France held the top HS3304 import position from the 1990s through the early 2020s, confirmed by CIAJ. The United States followed in second. Korea barely registered.

Chart 5:
HS3304, JPY value, France / Korea / USA, monthly 2005–2025
Source: Japan Ministry of Finance / JapanTradeStatistics.com
The Shift
Korea’s rise was not sudden. It was a decade of compounding forces.
The Korean Wave, Hallyu, arrived in Japan as entertainment, not trade strategy. K-dramas. K-pop. A generation of Japanese consumers whose aspirational reference point became Korean, not Parisian. Korean brands can move from formulation to shelf in under eight months; European brands typically take close to two years. In a market where ingredient trends cycle in months, that is not an advantage, it is a different industry. From around 2020, K-beauty entered a second phase: stronger branding, more sophisticated formulations, mid-range pricing that delivered genuine quality without luxury price tags.
The Crossover
In 2020, Korea overtook the USA to become Japan’s second-largest HS3304 import origin. The decisive moment came in 2022:

Thirty years of French dominance in HS3304, ended by less than 1.5%.
Since 2022, Korea has held the top position without interruption. By 2025: Korea 30.8%, France 22.8%. An 8 percentage point gap, and widening.
Volume vs. Value, The Toggle That Changes Everything
Switch the same HS3304 chart from JPY to KG using the toggle button in the bottom right corner of any JapanTradeStatistics.com chart. The picture changes completely.

Chart 6:
HS3304, KG volume, France / Korea / USA, 2005–2025
Note: Single spike ~April 2020 = erroneous customs declaration. Does not reflect real trade.
Source: Japan Ministry of Finance / JapanTradeStatistics
France: Flat volume for twenty years. France was extracting more yen from the same physical quantity. A pure price premium strategy.
USA: Flat then declining sharply. Losing actual physical shipments, not just value share.
Korea: From 300,000 KG in 2005 to 5 million KG in 2025. A volume increase of approximately 1,500%, with the majority concentrated in the last six years.
Korea is winning on both dimensions simultaneously, more product and more value. France maintains a premium position, but not market expansion. The USA is losing on both.
Part Five: Where Industry Reports Go Wrong
Most industry reports say the same thing: Korea leads skincare; Europe retains strength in colour cosmetics, particularly eye makeup.
Grand View Research, reporting in 2023, places Europe as the dominant force in global eye makeup, 34.8% revenue share, with France cited as a key contributor. CIAJ’s own 2025 report notes eye makeup imports declined everywhere except France, widely interpreted as confirmation that France is holding its ground.
These are not fringe publications. They are the reports brand managers read, consultants cite, and market entry strategies are built on.
The JapanTradeStatistics.com data at HS9 level tells a materially different story
The chart for HS330420000, eye makeup, JPY value, France, Korea, and China, annual 2015–2025, reveals a competitive structure the industry consensus has entirely missed:

Chart 7: HS330420000 (eye makeup), JPY value, France / Korea / China, annual 2015–2025 Source: Japan Ministry of Finance / JapanTradeStatistics
Korea: #1. Having overtaken China around 2018–2019.
China: #2. The established second-place supplier throughout the entire decade.
France: #3. Consistently. Throughout the entire period.
France has never led eye makeup imports to Japan. And China, entirely absent from the industry narrative, has been in second place for the entire decade.
The CIAJ note that France grew in eye makeup in 2025 is accurate for that single year’s movement. It does not change the structural picture: France is third in a market led by Korea, with China in second.
Why the gap? Market research relies on retail data, brand disclosures, and consumer surveys. Customs data measures something else: what physically crossed the Japanese border, declared at point of entry, by product, country, month, kilogram, and yen. Legal declarations, not estimates, not models. These are different realities, and the gap between them is material, not marginal.
JapanTradeStatistics exists for this reason. To show what is actually happening, not what the consensus says is happening
Part Six: The Real Structure of HS3304, Only Visible at HS9 Level
HS3304 is not one product. At HS9 level, the granularity JapanTradeStatistics.com provides, the competitive story differs meaningfully across each sub-category. All values in billions of yen.

HS330410000, Lip Makeup
France was the historic leader here, running at approximately ¥7 - 12 billion throughout 2015–2024 while Korea was near zero. Korea’s sharp acceleration from 2022 onward brought it to approximately ¥20 billion by 2025. The crossover happened around 2022–2023. China is marginal throughout at approximately ¥2–3 billion. France built and held this category for years before Korea overtook it very recently.

Chart 8:
HS330410000 (lip makeup), JPY value, France / Korea / China, annual 2015–2025
Source: Japan Ministry of Finance / JapanTradeStatistics.com
HS330420000, Eye Makeup
The most structurally misunderstood sub-category in the entire HS3304 market.

China held the top position until Korea overtook it around 2018–2019. Korea peaked at approximately ¥8 billion around 2022–2023, then pulled back to approximately ¥6.5 billion. China declined from its ¥6 billion peak to approximately ¥4 billion. France grew from ¥2.5 billion to approximately ¥5 billion around 2022, then also pulled back to approximately ¥4 billion. France is third. It has always been third.

HS330430000, Nail and Manicure Preparations
The most unexpected finding in the sub-category analysis. China dominates. France is second. Korea is absent.
China grows from approximately ¥1.2 billion in 2015 to approximately ¥4.5 billion peak by 2024. France holds a stable second at approximately ¥1.5–1.8 billion. Korea has essentially no presence. This is the one clear example within HS3304 of Chinese category leadership, and the one category where Korea’s dominance simply does not apply.
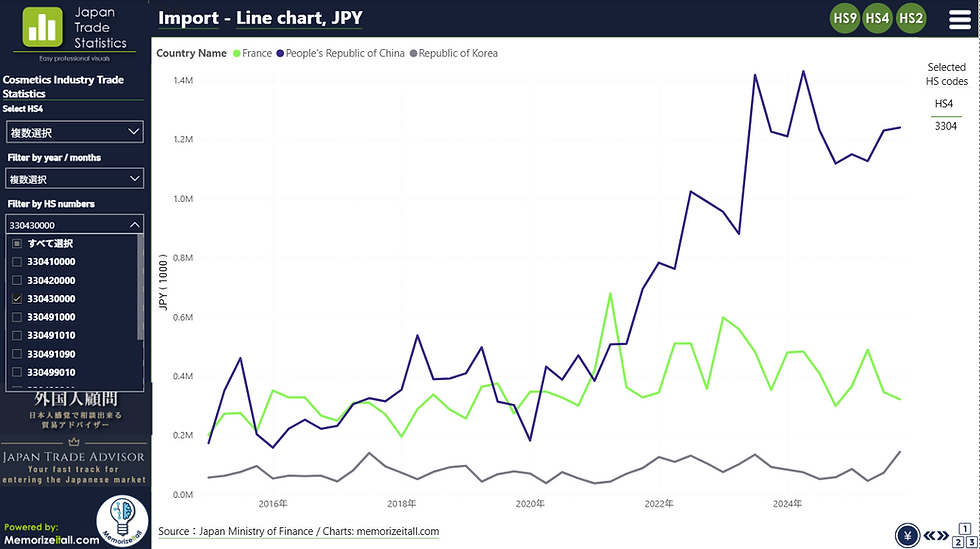
Chart 9:
HS330430000 (nail/manicure), JPY value, France / Korea / China, annual 2015–2025
Source: Japan Ministry of Finance / JapanTradeStatistics.com
HS330491010 and HS330491090, Face Powders
Both codes show data only through approximately 2022, consistent with a customs reclassification. Within the available period, France initially led in HS330491010 before Korea overtook it around 2021–2022. HS330491090 shows Korea accelerating sharply toward 2022, France flat, China marginal. Because the series are truncated, no conclusions about current competitive positioning in these codes can be drawn.
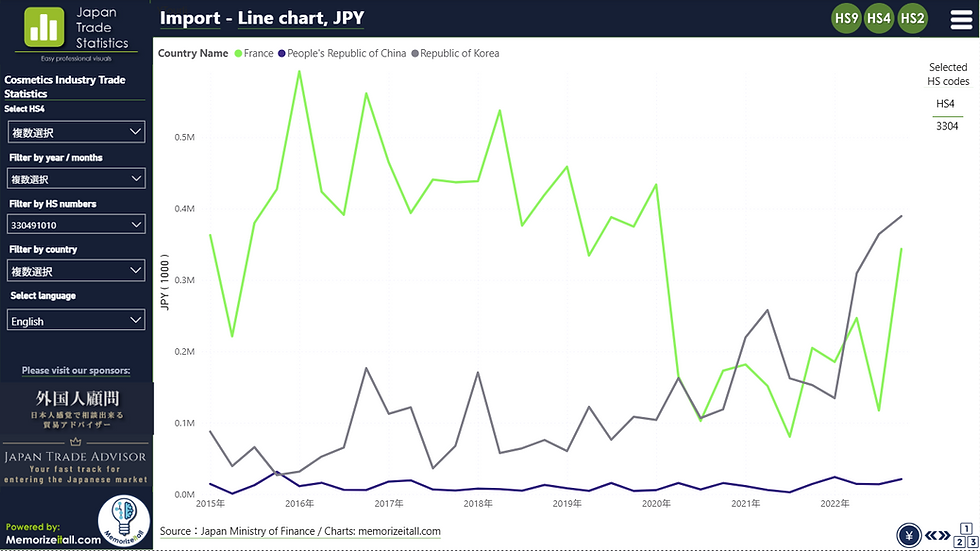

HS330499010 and HS330499011, Skincare Specific and Sunscreen
Sunscreen (HS330499011): Korea’s clearest single-category victory. Korea grows to a peak of approximately ¥2.5 billion around 2023. France runs flat at approximately ¥0.3–0.5 billion throughout. Korea leads France by approximately 4–5 times.

Skincare Specific (HS330499010):
Korea at approximately ¥4.5 billion, France at approximately ¥3.5 billion, both from approximately 2022–2023 onward. Both entered simultaneously, consistent with receiving reclassified products from the former powder codes. Korea leads France by approximately ¥1 billion on average.

HS330499012 and HS330499019
HS330499012 is a marginal category running at approximately ¥100–250 million, roughly 100 times smaller than the main codes. Both France and Korea show similar small values.
HS330499019 shows France leading Korea (approximately ¥1.5–2 billion vs ¥0.5–1 billion) through approximately late 2023, after which the data stops due to reclassification. Neither code is large enough to materially affect the overall competitive picture.


HS330499090, The Engine of Korean Dominance
The single most important sub-code in HS3304. France led this code until approximately 2019–2020, running at approximately ¥10–14 billion while Korea built from approximately ¥3 billion. Korea crossed above France around 2019–2020 and accelerated dramatically, reaching approximately ¥37 billion by 2025. France continued growing more modestly to approximately ¥21 billion. China is essentially absent. Korea’s lead is approximately 1.75:1 and growing.

Part Seven: Price Reveals Strategy
Is Korea winning on price or on preference? No public source can answer this from secondary data alone. JapanTradeStatistics.com can, by calculating implied unit value (JPY per KG) at HS9 level, by country, over time.

Chart 13:
HS330499090, Price per unit (JPY/KG), France vs Korea, 2015–2025
Source: Japan Ministry of Finance / JapanTradeStatistics
France: approximately ¥7,000 per KG in 2015. Highly volatile throughout, ranging ¥6,000–¥9,000 through 2021, then accelerating sharply from 2022 onward, reaching approximately ¥14,000–¥15,000 per KG by 2025. The highest point in the entire dataset.
Korea: ¥3,000/KG in 2015. Declines to approximately ¥1,200 around 2019–2020. Then recovers steadily to ¥4,500–5,000 by 2024–2025. More than tripled from its low.
Two parallel markets now operate within the same HS code:
France: Ultra-premium segment at ~¥12,500/KG. Lower volume, higher margin per unit.
Korea: Accessible-premium segment at ~¥4,500–5,000/KG. Higher volume, lower margin per unit.
Notably, Korea’s pricing has more than tripled since its 2020 low. This confirms real premiumisation, not just volume growth. Korea is not selling cheap. It is selling at a price point the largest number of Japanese consumers are willing to pay.
What the data cannot tell us is whether France’s accelerating unit price reflects deliberate premiumisation, a product mix shift toward higher-value items, the effect of the weak yen on euro-denominated pricing, or some combination. The customs record captures the import price. The reason is not in the data.
Part Eight:
Why European Brands Lost the Skincare Battle
France did not lose Japan’s skincare and makeup market because Korean products got lucky. European brands made a series of compounding strategic errors. The customs data is the evidence.
Mistaking Heritage for a Moat
European brands spent decades building prestige in Japan. Department store counters. Premium packaging. French words on the label. It worked, until it met a serious competitor offering equally refined products at accessible prices, with marketing calibrated to how Japanese consumers actually live.
Heritage is an asset. It is not a substitute for product relevance.
A Two-Year Clock in a Six-Month Market
Korean brands move from formulation to shelf in under eight months. European brands take close to two years. In a market where ingredient trends cycle in months, that is not a disadvantage, it is a structural disqualification from competing in the fastest-moving segments.
Pricing for Yesterday’s Consumer
Japan’s economy has been stagnant for decades. The yen has weakened significantly. European luxury cosmetics were priced for an era of Japanese consumer confidence that has not returned. Korea identified the accessible-premium gap, genuine quality at a price point Japanese consumers could justify daily and occupied it completely.
Selling Where Consumers Used to Shop
Korean brands built presence through pharmacies, drugstores, and e-commerce, high visibility, low commitment, easy trial. French brands are anchored in department stores under sustained structural pressure. The channels are different. The consumer journeys are different. And one set of channels is growing while the other is not.
The Cultural Reference Point Has Moved
The generation of Japanese consumers now driving cosmetics purchasing grew up with Korean dramas and Korean pop music. Their beauty aspirations are Korean. European brands marketing European aesthetics to this consumer are not just losing on product. They are losing on aspiration.
None of this applies to fragrance. The aspirational reference for Japanese fragrance consumers remains overwhelmingly European. The cultural shift that damaged France in HS3304 has not touched HS3303. That distinction, visible only when you look at both codes together, is why the full picture matters.
Part Nine:
The Competitive Map Today
Korea, Dominant in Skincare, Absent in Fragrance
Korea leads every major continuous HS3304 sub-category: skincare catch-all (HS330499090), sunscreen (HS330499011), and lip makeup (HS330410000). It leads in both volume and value, and its unit prices are rising. The position is not built on cheap product.
But Korea has essentially no presence in fragrance (HS3303). Its entire Japan cosmetics position rests on HS3304. That concentration is simultaneously its greatest strength, it owns the fastest-growing consumer category, and a structural vulnerability. A single-code dominance is less resilient than a multi-category position.
Growth has normalised: +40% in HS3304 in 2024, +5.6% in 2025. Japan’s total HS3304 market growth fell from 17.7% to 3.1% over the same period. Korea’s share continued rising even as the growth rate fell. The structural position is intact.
France, Retreating in Skincare, Unchallenged in Fragrance
France’s position across the full cosmetics picture is more nuanced than the K-beauty narrative suggests. In HS3303, it is dominant, accelerating, and unchallenged. In HS3304, it has lost the skincare battle and is extracting value through ultra-premium pricing at ~¥12,500/KG.
The data raises a critical question it cannot answer: does France’s accelerating unit price reflect successful premiumisation, or a shrinking customer base paying more as mass-premium consumers migrate to Korea? Both interpretations fit the data. The chart alone does not resolve it.
France’s genuine HS3304 positions: second in skincare catch-all at ~¥21 billion, second in lip makeup at ~¥10 billion, and growing in eye makeup even as it remains third. It also leads nail preparations in second place behind China.
Below is shown Frances's export of HS33, the share of each HS4s (HS3301, 3302, 3303, 3304 etc) in Kg and value from 2015 to 2025.


It says volume in the chart header but it is JPY as written in the right side of the chart.
China, The Market’s Most Underreported Force
At ~¥100 billion in total cosmetics imports annually, China is one of Japan’s largest cosmetics suppliers. It is described as an “emerging challenger.” The data does not support that description.
Within HS3304: dominant in nail preparations (~¥4.5 billion peak), established second in eye makeup (~¥4–6 billion), growing presence in skincare specific codes from 2023. In the largest skincare code (HS330499090), China is essentially absent. China’s is category-specific, strong where it operates, invisible where it does not. This nuance is only visible at HS9 level.
Ireland, A Supply Chain Artefact
Ireland’s ~¥20–25 billion annual cosmetics “exports” to Japan reflect corporate structure, not Irish consumer brand strength. Several multinational cosmetics groups use Ireland as their European manufacturing or headquarters base. The products recorded as “Irish” in Japan’s customs data include brands that Japanese consumers would not associate with Ireland at all.
Italy, Steady Premium Growth
Italy grows slowly but consistently from ~¥10 billion to ~¥20 billion annually. Within HS3304 it has particular strength in colour cosmetics. It is following the premium positioning model, high value per kilogram, modest volume, that made France dominant for thirty years.
USA, Twenty Years of Standing Still
In 2005, the USA was the second-largest cosmetics supplier to Japan, comparable to France in total value. Twenty years later it has been overtaken by Korea, China, and Ireland, and is barely ahead of Italy. Flat performance across two decades, while every major competitor grew, represents a structural failure to capture any of Japan’s cosmetics import growth.
Part Ten:
What This Means for Market Participants
For Korean Brands
The HS3304 position is strong. Volume, value, and unit price trends all confirm it. The normalisation of growth rates in 2025 is not reversal.
The strategic question is whether HS3304 dominance can extend into adjacent categories, particularly HS3303 fragrance, where Korea currently has no meaningful presence and France is accelerating. Single-category dominance is a strong position. Multi-category presence is a more resilient one.
For French and European Brands
The full picture is more favourable than the K-beauty narrative suggests. France’s total cosmetics exports to Japan are at all-time highs. HS3303 is growing strongly and unchallenged. The HS3304 losses are real, but they are offset by fragrance gains that most industry commentary ignores.
The critical question: is France’s ~¥12,500/KG HS3304 unit price a sustainable premium moat, or a retreat into a shrinking niche? The customs data raises it. Consumer research is required to answer it.
Genuine HS3304 opportunities remain: eye makeup (HS330420000), growing even from third place; nail preparations (HS330430000), stable second behind China; and any category where genuine product innovation, as opposed to heritage positioning, drives purchasing decisions. Italy’s steady growth demonstrates that European brands with the right product can still gain ground.
For Chinese Brands
The data confirms established positions that the industry has not noticed. Dominant in nail preparations. Established second in eye makeup. The strategic question is whether these can extend into the larger skincare codes, particularly HS330499090, where China currently has minimal presence despite being a major force in adjacent categories.
For Japanese Importers and Retailers
The channel story matters as much as the origin story. Korea built HS3304 presence through pharmacies, drugstores, and e-commerce. France’s HS3304 position is anchored in department stores under structural pressure. France’s HS3303 position is built on gift culture and premium retail, a more resilient channel.
The unit price gap in HS330499090, France at ~¥12,500/KG, Korea at ~¥4,500–5,000/KG, is not just a pricing difference. It represents two fundamentally different business models, two different customer segments, and two different retail environments. Choosing between them is a strategic decision, not a preference.
Part Eleven:
The Real Conclusion
The conventional story says: Korea dethroned France.
The data says something more interesting.
Korea won skincare and makeup (HS3304). Real. Structural. Confirmed at every level of granularity the data provides.
France built a fragrance empire (HS3303). Unchallenged. Growing. At all-time highs. Invisible in the K-beauty narrative.
China became a major but overlooked force. ~¥100 billion annually. Second in eye makeup. Dominant in nail preparations. Described as “emerging” while already established.
The USA stood still for twenty years. From top-tier supplier to fifth place. Without comment.
Korea won the battle that everyone sees. France is winning the one most people missed. And the only way to see both clearly is to start with the full market, include all the relevant codes, compare all the relevant countries, and trust the data over the narrative.
Data Note
All import figures are derived from Japan Ministry of Finance customs declaration data, accessed and visualised through JapanTradeStatistics. This report covers HS4 codes 3303 and 3304, with HS3304 analysed at HS9 sub-code level, plus the combined HS3301–3307 overview in Part One.
CIAJ (Cosmetics Importers Association of Japan) annual figures are referenced for HS3304 headline market share data.
One volume data anomaly: a single erroneous customs declaration in Korea’s HS3304 volume data creates an apparent spike in April 2020, confirmed by monthly filtering. It does not affect any trend conclusions.
HS9 classification revisions: Codes HS330491010, HS330491090, HS330499012, and HS330499019 show data only through 2022 or 2023, reflecting either confidentiality processing (秘匿化処理) or periodic HS revision. The simultaneous appearance of significant values in HS330499010 from early 2023 is consistent with reclassification from these discontinued codes. For official correspondence tables: Japan Tariff Association (kanzei.or.jp) and Japan Customs (customs.go.jp).
A note on import data vs consumer demand: Customs data records imports at the point of entry, not at point of sale. Import share and consumer market share are related but not identical. Sustained multi-year growth combined with rising unit prices is more consistent with genuine demand pull than inventory accumulation, but the customs data alone cannot fully confirm this.
External reports referenced: Grand View Research global eye makeup market (2023); CIAJ annual data (2025); Mordor Intelligence Japan cosmetics market report.
Access the complete dataset, HS3303, all HS3304 sub-codes, monthly data, country filtering, unit price charts, and the JPY/KG toggle, at japantradestatistics.com
Key Facts

Go deeper than headlines. Work with the data yourself
Observations in this article are based on Japan’s official trade statistics (Ministry of Finance), explored and visualized through JapanTradeStatistics.com.
The platform (japantradestatistics.com) allows you to:
Save time on downloading data, creating charts in excel. You can focus on analysing the data.
Download trade data for any HS4s you wish (for some data we need up to 24 hours to prepare).
Visualize your findings in seconds in easy-to-understand charts
Drill down into specific HS4 codes, to analyze the data
Drill down into multiple HS4 codes of you own choice in same file / chart
Instant chart creation (Lots of variations) Line-, bar-, doughnut-, accumulated-, 100% bars-, box-, YTD and map chats. Check chart types available here.
Compare countries, time periods, and shift in supplier countries / trends - instant visual creations
Identify structural trends vs temporary noise (data from 1999 and to today)
Create presentation-ready charts in just minutes, always using the latest available data
Export charts directly into PowerPoint ensuring your presentation always has latest and real-time data - create one page, use it month after month with updated data without having to create it again and again
If you want to explore other HS4s, focus on specific countries, or test alternative scenarios, you can do this yourself using the platform, quickly, precisely, and without waiting for custom reports.
No time-consuming import of data
No messing with excel
Just select and you have your chart instantly

Check out our YouTube to see how easy it is here: https://www.youtube.com/@JapanTradeStatistics
For users who need tailored insights, we also provide:
Custom chart creation on request
HS-level market analysis (please accept partially AI generated analysis)
You are welcome to ask for any other service you might think we can offer
For analyzing yourself, you need to become member (500 JPY + VAT / month) and purchase a HS4 dataset (500 JPY +VAT / month). You can at any time cancel your membership and HS4 dataset easily.

In addition, we offer business consulting services for both Japanese and non-Japanese companies, both import & export, supporting:
Market entry and expansion on the Japanese market
Export and import strategy
Data-driven decision-making in the Japanese market
JapanTradeStatistics.com is designed to give you clarity first, so strategy can follow.
Check out:
My resume: https://www.kimjapan.com/
Business services for Japanese people: https://www.gaikokujinkomon.com/
Business services for non-Japanese: https://www.japantradeadvisor.com/
Memorizing anything: Memorizeitall.com For both kids & professionals


Comments